The Galaxies of the Virgo Cluster
Background Information
This project entails using measurements of the atomic hydrogen emission toward a sample of Virgo Cluster galaxies to understand their physical conditions and galaxy types. The following sections give information that you will need to complete this project. If you are wondering what a particular abbreviation or acronym means, I have collected those used (and not defined in-line) in the abbreviations section at the end.The HI 21cm Line
Hydrogen is the most abundant element in the universe, a fact that has been known for decades. In the early 1900s it was known that hydrogen can be detected in ionized (warm) environments through its recombination transitions, but detection in the general low-temperature, low-density interstellar medium (ISM) seemed to be a challenge. In 1944 the Dutch astronomer Hendrik van de Hulst (while still a student at the University of Utrecht) predicted that neutral hydrogen (HI; pronouced "h one") atoms would be detectable via a "spin-flip" hyperfine transition which had a predicted wavelength of = 21 cm (
 =1420.405751 MHz). It wasn't until March 25th, 1951 that the first 21 cm line was successfully detected by Doc Ewen and Edward Purcell of Harvard University. Hyperfine transitions result from the fact that two energy levels result from the magnetic interaction between the quantized electron and proton spins in the hydrogen atom. When the relative spins change from parallel to antiparallel, a photon with a wavelength of about 21cm is emitted.
 HI 21cm spin flip transition |
Now, the prediction that this spin-flip transition would be detectable in the universe was met with a bit of skepticism because the probability of this spin-flip happening was calculated to be very small. The calculation of the probably that an atomic transition will occur involves determining its "Einstein A", or "spontaneous emission" coefficient:
 where
where  is the mean magnetic dipole moment for HI in the ground electronic state (n=1),
  is the frequency of a transition from the upper hyperfine to the lower hyperfine state, and
  is the speed of light in a vacuum (
 . Plugging in the values for
  ,
,  , and the emission coefficient of the 21 cm line is
 and its radiative half-life is
 That is a very long time to wait to see the hydrogen atom spin flip! Fortunately, it turns out that there is a lot of hydrogen in the universe, so the sheer numbers of hydrogen atoms makes this spin flip transition, and thus hydrogen itself, detectable in the universe.
Further Reading:
That is a very long time to wait to see the hydrogen atom spin flip! Fortunately, it turns out that there is a lot of hydrogen in the universe, so the sheer numbers of hydrogen atoms makes this spin flip transition, and thus hydrogen itself, detectable in the universe.
Further Reading: - The Hydrogen Spin-Flip Transition: Some more background on the hydrogen atom spin-flip (hyperfine) transition.
- Doc Ewen and the Discovery of Radio Emission from Hydrogen: Historical description of the discovery of the 21cm transition from hydrogen.
What Can We Measure with HI?
There are a number of fundamental physical measurements that we can make using HI:Column Density and Mass
By "counting" the number of hydrogen spin-flip transitions along a particular direction we can calculate how much hydrogen there is along a particular line of sight in the universe. The equation for this sum is given by: where
where  is the "brightness temperature" (measured in K, or Kelvin) of the HI emission and
  is the width of the HI emission we measure (measured in km s
 ). We can take this calculation one step further by noting that if we know how many hydrogen atoms there are in a particular direction, and since we know the mass of the hydrogen atom, we can calculate the total mass of HI in a particular direction:
 where I have used a few things here that I have not mentioned yet:
 - We can estimate the physical size of the galaxy (
 ) by using the formula for the angle subtended by the galaxy at distance
  , which is
  . Since galaxies are a long ways away we can use the fact that, for small angles,
  .
.
- Most things are a long ways away in astronomy, so we need to use a unit of distance which gives us numbers that are not, well, astronomical. One unit of distance is called a "parsec", which is defined as the distance at which the separation between the Earth and the Sun would be one arcsecond. One parsec equals about
 .
.
- In the same way that distances are often really big in astronomy, so are the masses of things. For this reason we often measure masses of objects in terms of the mass of the Sun. This is called the "solar mass" unit, and it is denoted by the symbol
 . One solar mass is equal to about
  .
.
Distance
Since we know what the frequency of the HI line is (about 1420 MHz), we can determine the radial velocity ( ) of a galaxy by noting how much its HI line frequency is shifted by the Doppler effect. The relationship between the rest frequency and the frequency of a photon emitted by a moving object traveling at velocity is given by the Doppler equation:
 Now, to connect this to the distance to the galaxy, we use the fact that the radial velocity of a galaxy is the sum of the recession velocity caused by the uniform Hubble expansion of the universe and the "peculiar" velocity of the galaxy. The radial component of the peculiar velocity reflects motions caused by gravitational interactions with nearby galaxies and is typically
  in magnitude. The Hubble velocity is proportional to distance from the Earth, and the Hubble constant of proportionality has been measured as
  . If the radial velocity is significantly larger than the radial component of the peculiar velocity, the observed HI frequency can be used to estimate the Hubble distance D to a galaxy as follows:
 Be careful, though, as this distance estimate can be way off under certain circumstances!
Further Reading:
Be careful, though, as this distance estimate can be way off under certain circumstances!
Further Reading: - Definition of the Parsec: Some details on the parsec distance unit.
- The Solar Mass: Detailed description of the solar mass unit.
- The Doppler Effect: Detailed description of the Doppler effect.
Measurements of HI in Galaxies of the Virgo Cluster using the Green Bank Telescope (GBT)
How Do Radio Telescopes Make Measurements of Galaxies?
Radio telescopes use a variety of techniques to measure the radio emission from many astronomical objects, including galaxies. One of the standard measurements that a radio telescope makes is called a "spectroscopic" measurement. When a radio telescope makes a spectroscopic measurement it collects radio signals from an object for a fixed amount of time (a few minutes to several hours) and sends those signals to a spectrograph which spreads the signals out in frequency space. This spectrograph is turned into a collection of digital numbers which can be processed by a computer to make a "spectrum". 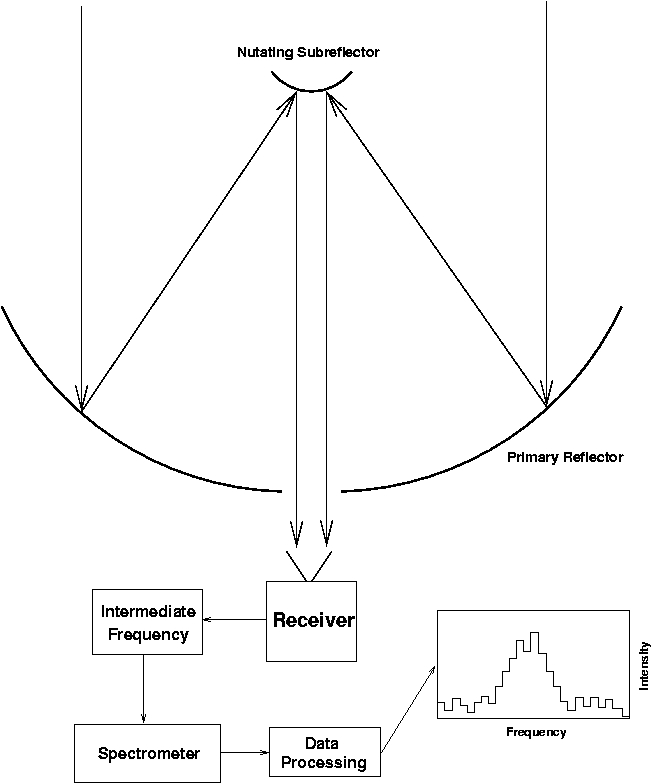 A basic radio telescope measurement |
One thing that a radio telescope needs to contend with is the "noise" from radio emission sources other than the object of interest (sometimes called "background sources"). For example, the Earth's atmosphere and the ground are strong sources of radio emission. In order to separate-out these other sources of radio emission a radio telescope will often use "switching" between one or more positions on the sky. One of the standard switching techniques is called "position switching", where the radio telescope alternately measures the radio emission toward the source of interest, then moves a short distance away on the sky to measure a position that the astronomer believes is free of astronomical sources, but also contains the background sources that need to be removed in order to bring-out the radio emission from the astronomical object.
 Fundamental observing modes used by a single dish radio telescope |
The Virgo Cluster
Review the information within the following links to learn more about the Virgo Cluster of galaxies:- The Virgo Cluster: Detailed information on the Virgo Cluster
- Atlas of the Virgo Cluster: "Atlas of the Universe" description of the Virgo Cluster. Nice displays of the locations and types of galaxies in the Virgo Cluster.
GBT Measurements of HI in Virgo Cluster Galaxies
In the following I show some recent HI spectra measured toward several galaxies in the Virgo Cluster of galaxies which were measured using the position switching technique.  M49 HI |
 M58 HI |
 M60 HI |
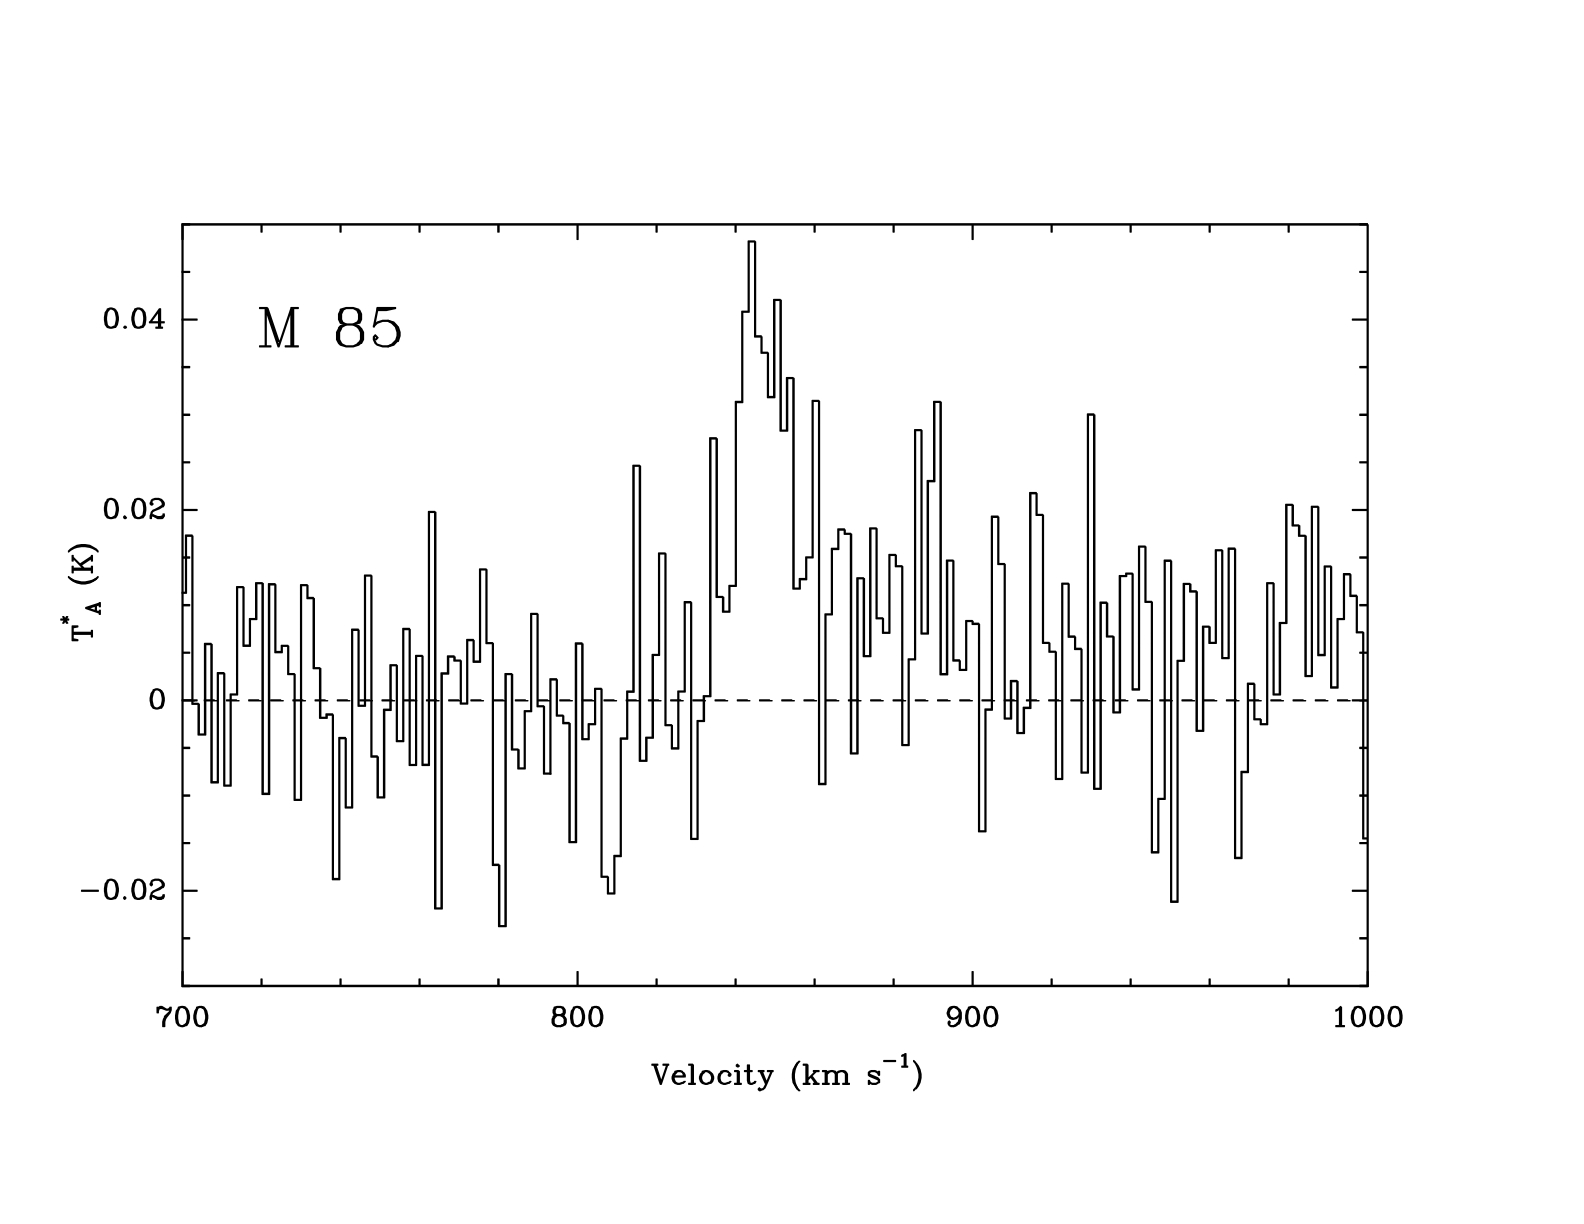 M85 HI |
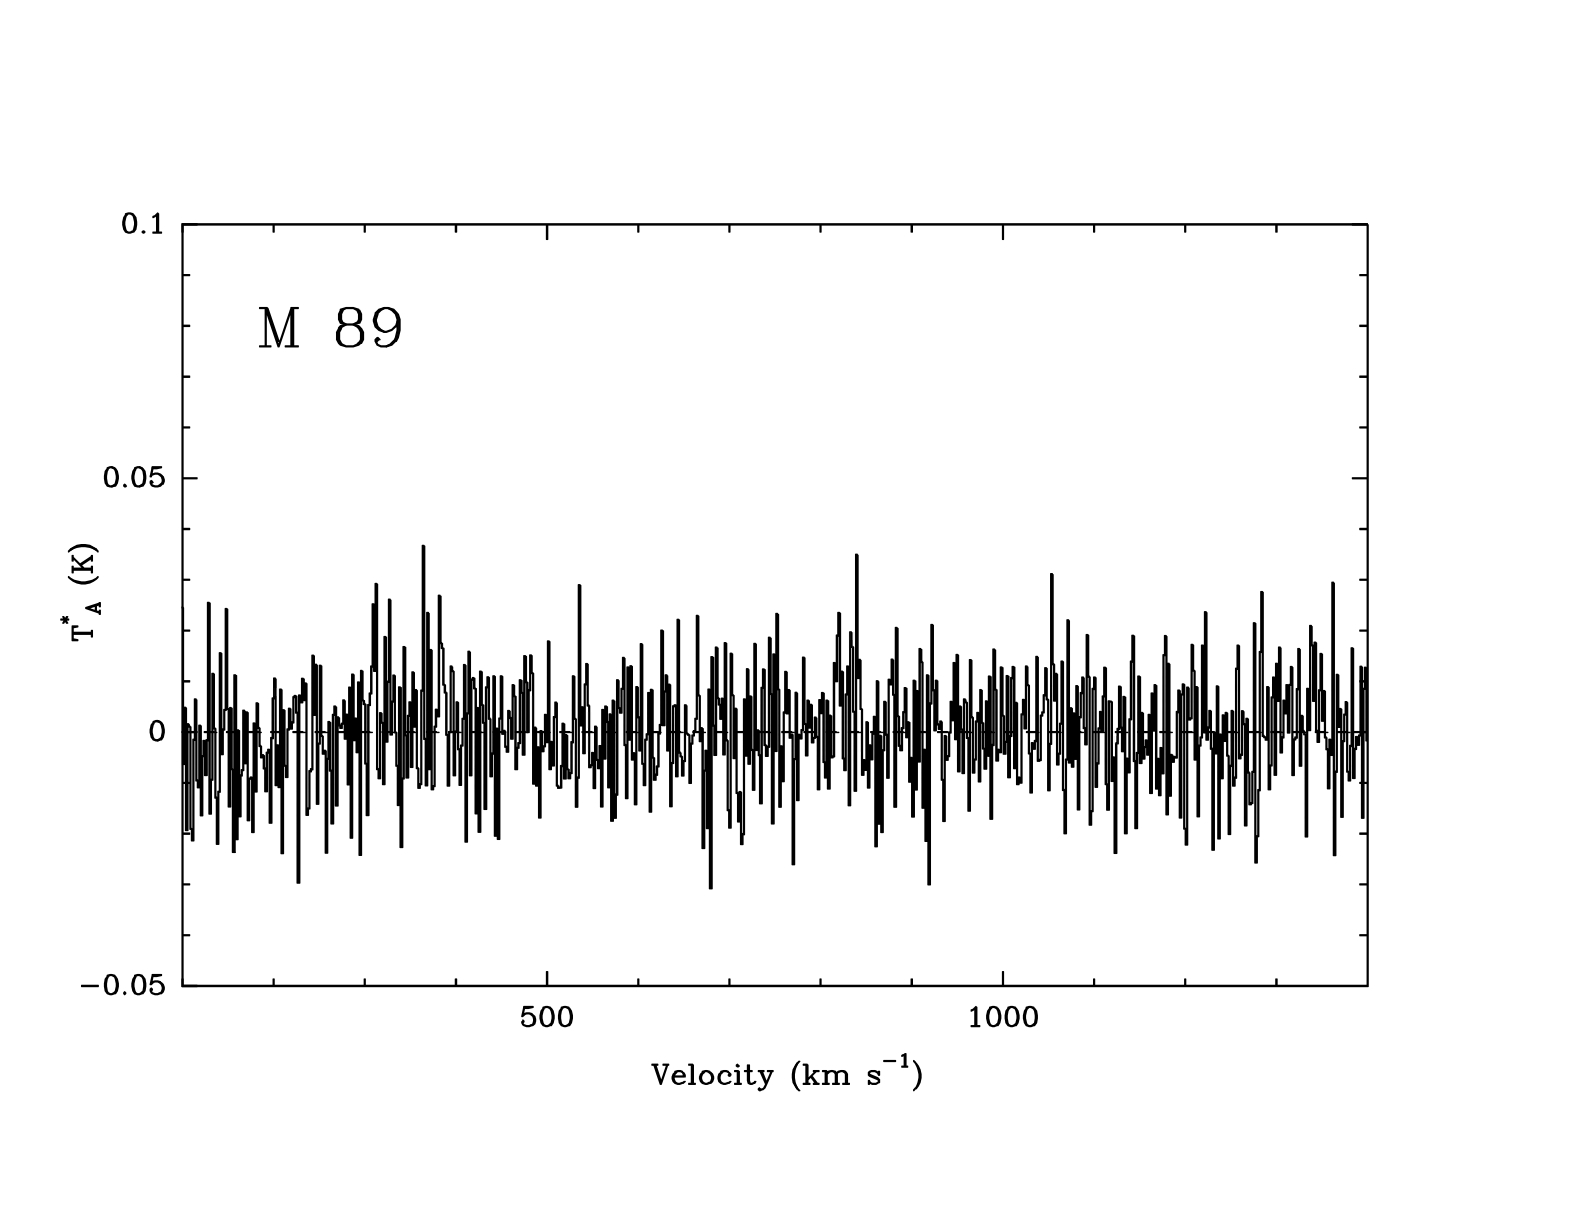 M89 HI |
 M91 HI |
 NGC4064 HI |
 NGC4189 HI |
 NGC4192 HI |
 NGC4216 HI |
 NGC4222 HI |
 NGC4254 HI |
 NGC4293 HI |
 NGC4294 HI |
 NGC4298 HI |
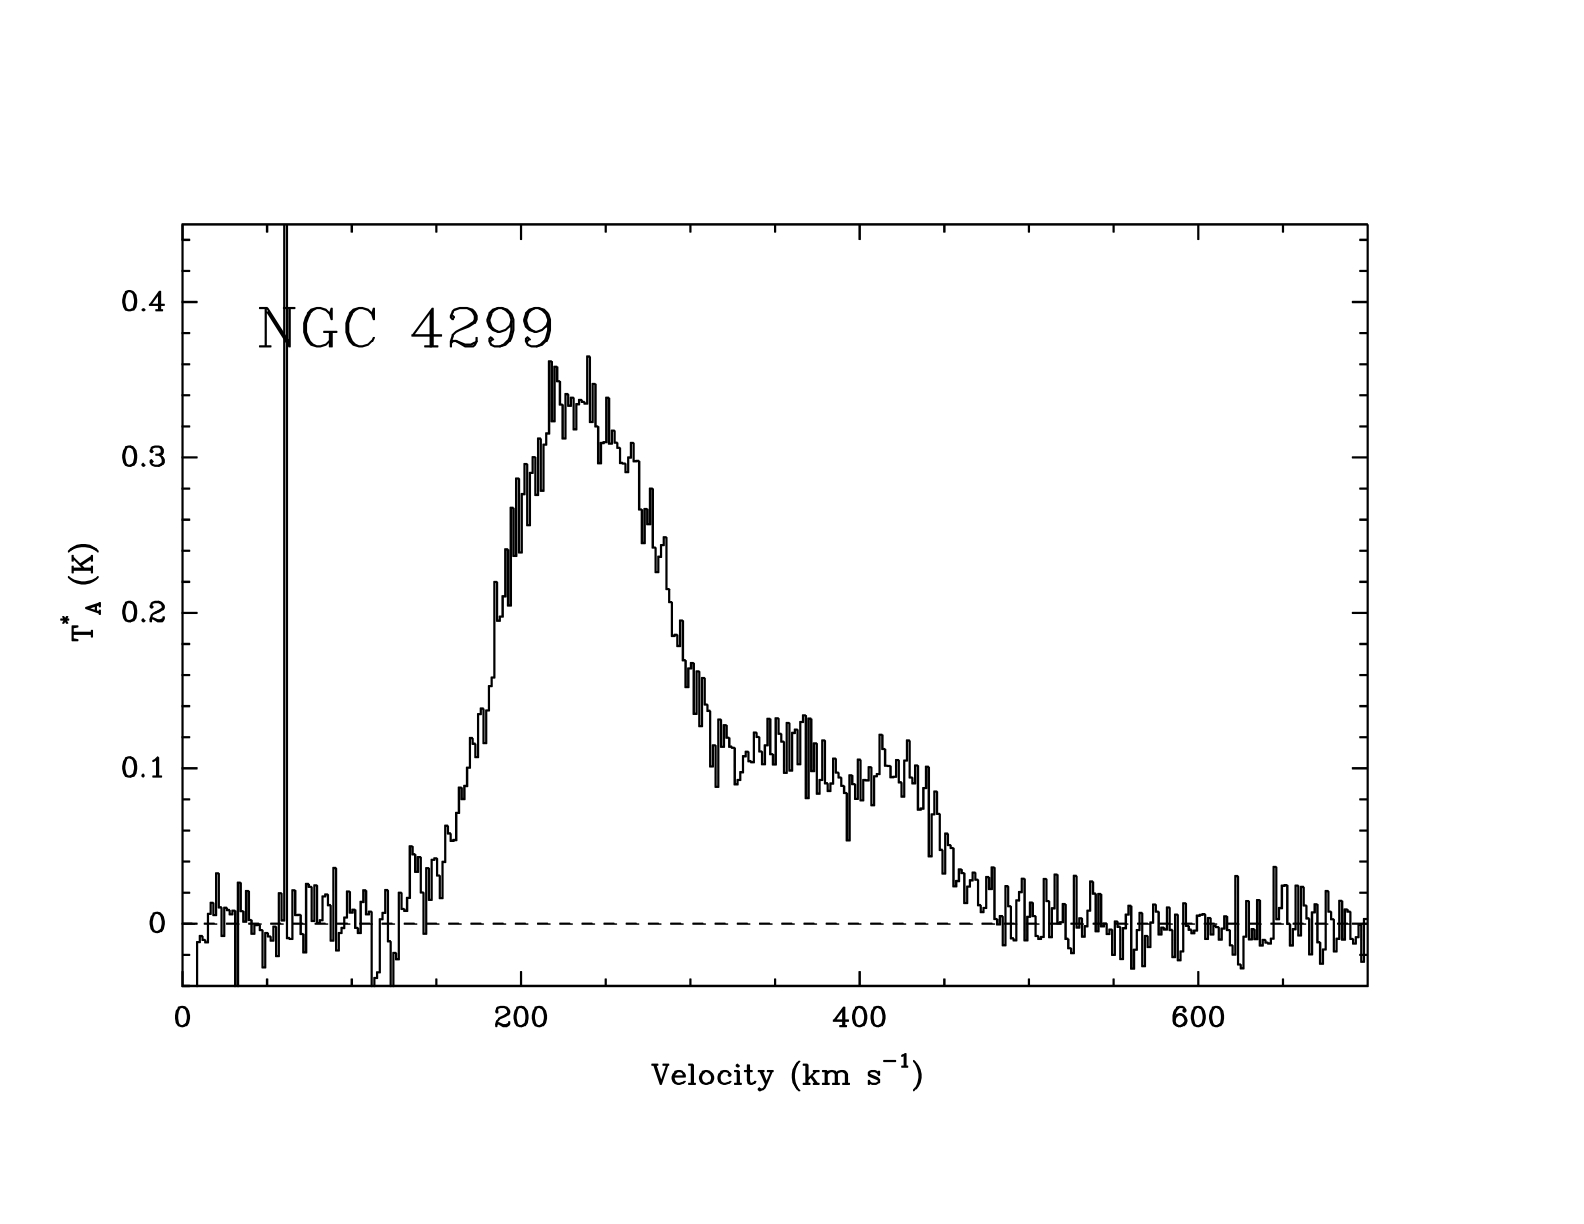 NGC4299 HI |
 NGC4302 HI |
 NGC4321 HI |
 NGC4330 HI |
 NGC4351 HI |
 NGC4380 HI |
 NGC4383 HI |
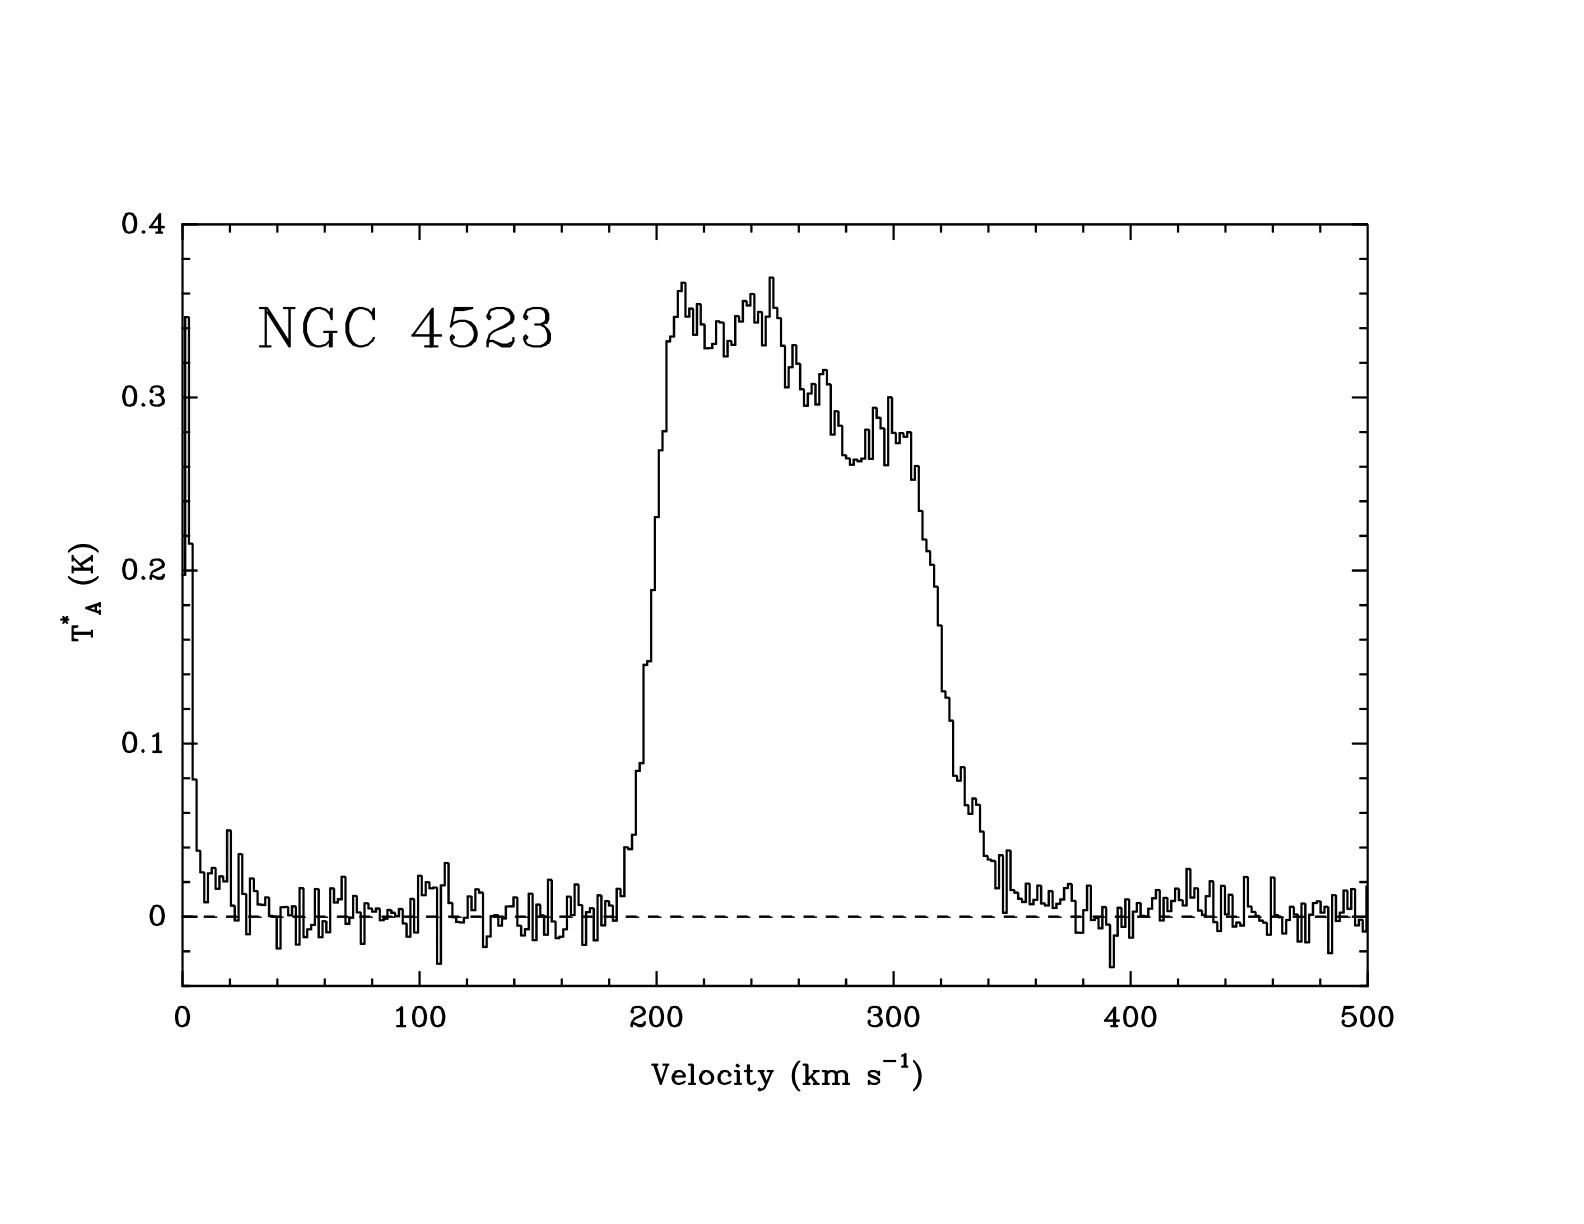 NGC4523 HI |
 NGC4567 HI |
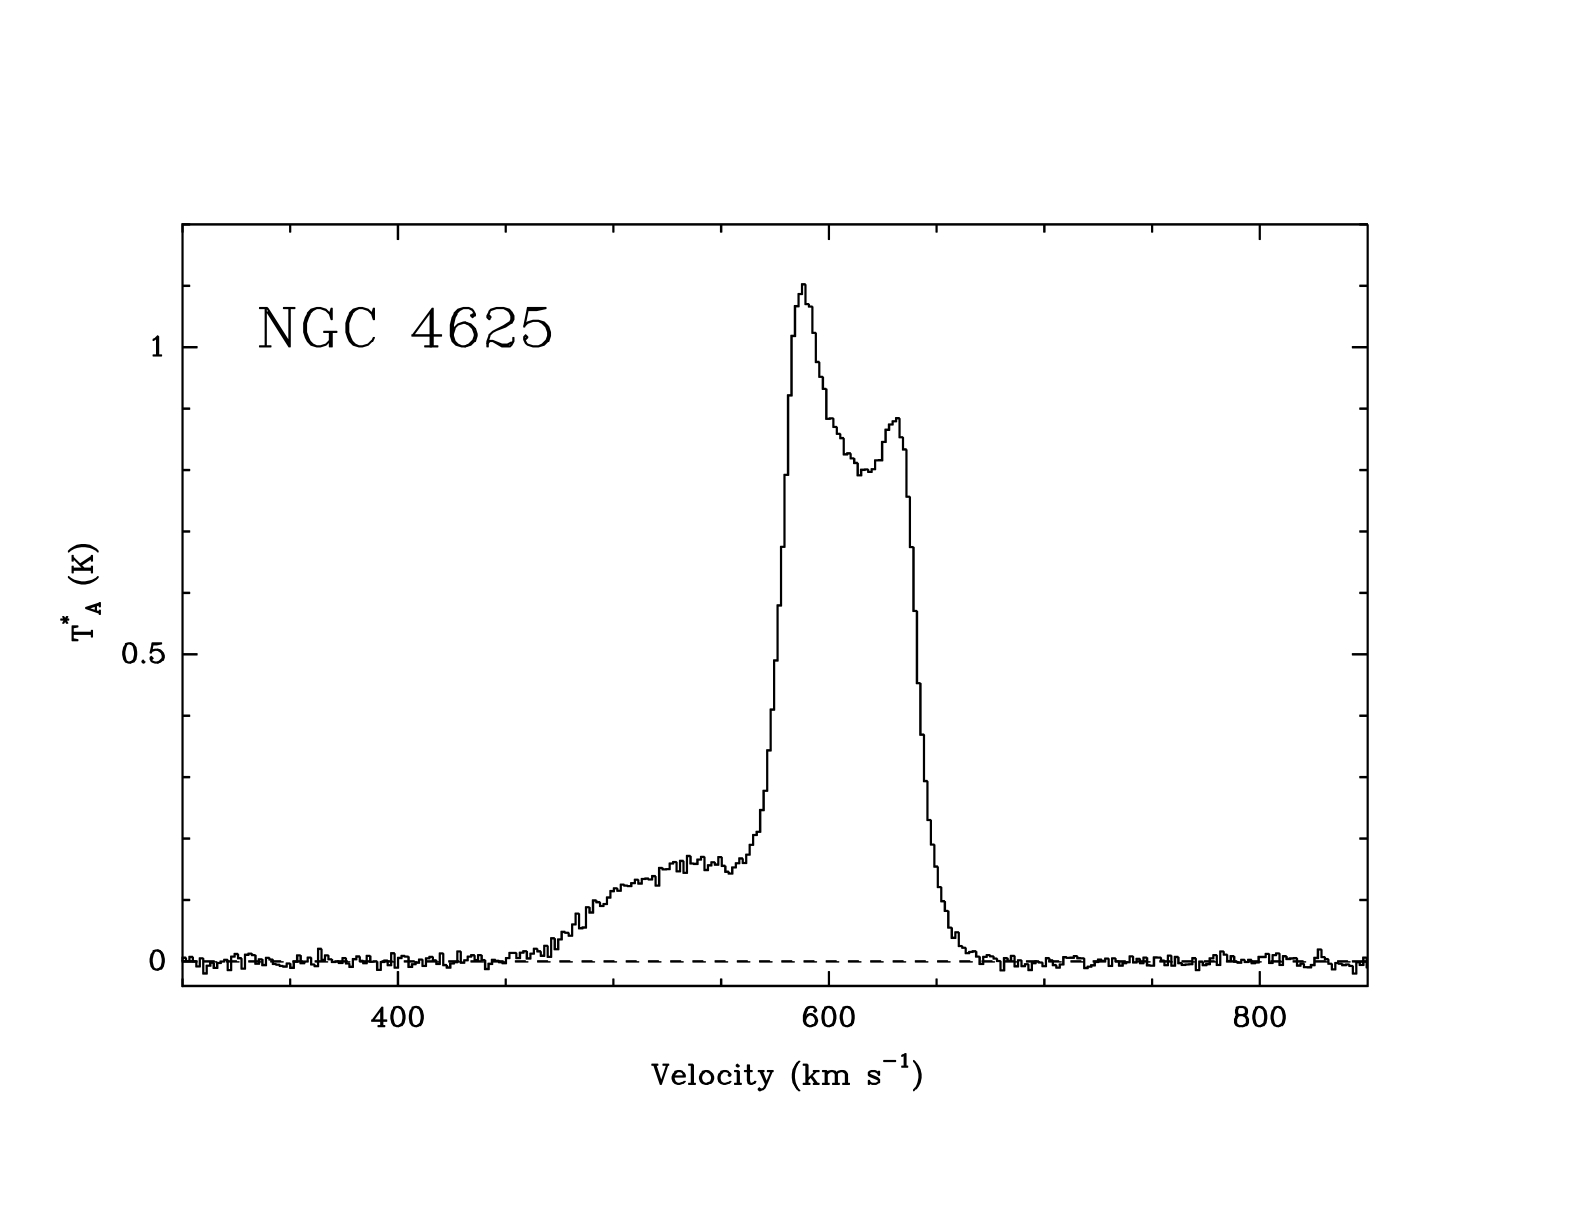 NGC4625 HI |
 NGC4713 HI |
 NGC4758 HI |
 NGC4762 HI |
Galaxy Classification
Read through the very nice and detailed description of how astronomers classify galaxies on Bill Keel's Galaxy Classification page. This page should give you the information you need to complete the galaxy classification parts of this project.Task List
For each galaxy in the Virgo Cluster sample, answer the following questions:- Determine some galaxy physical parameters:
- Recessional velocity (in km/s)
- Distance (in Mpc)
- HI column density (in
 )
)
- HI mass (in )
- Use the NASA Extragalactic Database (NED) to:
- Check some of the physical parameters you derived above. Note any differences.
- Note the galaxy type of each galaxy.
- If you see something unusual in the HI profile, make a note of it.
- How many galaxies of each type did you have in your sample?
- How many galaxies of each type did/did not contain HI?
- Which type of galaxy was the most massive? How about the least massive?
- How did the distances to each galaxy compare?
- Where is this galaxy located within the Virgo Cluster?
- Looking at the optical picture of each galaxy, what can you say about the way it looks (i.e. its apparent inclination) and the magnitude of the "horns" in the cases where the galaxy shows the characteristic "double horned profile"?
Example
Here is a "worked example" showing how to work through through the tasks listed above for the galaxy NGC4222. Determine Galaxy Properties Recessional Velocity: From the spectrum I can see that the HI line is centered pretty close to 225 km/s. I believe that this is its recessional velocity. To check this I go to NED. Select "search by name" and enter "NGC4222" in the "object name" box. A bunch of information pops up. The very first block of information listed is the "source list" block which lists quite a bit of basic information about NGC422. The "velocity" entry says "230 km/s". Woopie! I got it right! Note one other thing in this spectrum. There is a "second galaxy" detected. Can you tell me what that galaxy is??? Distance: I gave you the equation above which uses the velocity and something called the "Hubble Constant" to estimate a distance. Using this equation I get about 3.2 Mpc. Now I look on the NED listing for NGC4222. Scroll down to the "redshift-independent distances" block. You will find a table that gives a distance in Mpc. NGC4222 seems to be at a distance of 25.375 Mpc. What happened? Well, the simple calculation we used assumes that all galaxies particulate in what is called the "Hubble flow", or overall expansion of the Universe. Since NGC4222 is sitting in the Virgo Cluster, it experiences gravitational interactions with its other Virgo Cluster members. This results in "non-Hubble flow" motions which make the simple Hubble flow velocity calculation give a very wrong (in this case, off by almost a factor-of-ten) result. HI Column Density: Looking again at the HI spectrum for this galaxy, I see that its peak intensity is about 0.18 K (taking an eyeball-average of the peak along the "double horn" of its emission profile) and its velocity width is about 275 km/s (to its zero-intensity). Using the equation for N(HI) above with these measured values I get N(HI) .
HI Mass:
Using the same information that we gathered from the spectrum of NGC4222 for our N(HI) calculation, along with the correct distance we found from NED above, we can use the HI mass equation given above to calculate M(HI)
.
HI Mass:
Using the same information that we gathered from the spectrum of NGC4222 for our N(HI) calculation, along with the correct distance we found from NED above, we can use the HI mass equation given above to calculate M(HI)  .
Galaxy Classification:
You can get this from NED in the "Classifications" block under "Galaxy Morphology". Looks like NGC4222 is an "Sd: edge on". Now, you can actually double-check this by selecting the "images" link just below the black-and-white optical picture of NGC4222. You will have access to a bunch of images of this galaxy. See how the galaxy looks "edge-on", and kind of like a disk? This is a "spiral galaxy" that is viewed edge-on. Be sure to grab a nice picture from this list for your final report.
Location Within the Virgo Cluster:
Looking at the Atlas of the Virgo Cluster listed above, you can see that the Virgo Cluster is centered near RA = 12h 30m and has two main groups, one centered near Dec = 12d 30m and a second (less populated) one near Dec = 8d 0m. From the NED listing of NGC4222 we see that its RA and Dec are 12h 16m 22.5s and +13d 18m 25s. That would put NGC4222 in the northern (higher Dec) group of the Virgo Cluster, on the western (to the right side in the Atlas picture of the Cluster) part of that northern group. It also has quite a few "neighbors" nearby.
Optical Appearance and Shape of HI Spectrum:
The optical picture of NGC4222 suggests that this spiral galaxy is viewed by us as nearly edge-on. This means that we are seeing its stars and gas along its plane of rotation. What that does to the HI line profile is that it makes it so that the parts of the galaxy that are rotating away from and toward us show up more strongly in HI. This happens because those receding and approaching parts of the galaxy look from our point of view to show us all of the gas in those parts of the galaxy. This makes the "horns" larger, since we are seeing more HI emitting gas than if we were just looking at the galaxy perpendicular to its plane (i.e. if the galaxy appeared to us to be "face-on").
.
Galaxy Classification:
You can get this from NED in the "Classifications" block under "Galaxy Morphology". Looks like NGC4222 is an "Sd: edge on". Now, you can actually double-check this by selecting the "images" link just below the black-and-white optical picture of NGC4222. You will have access to a bunch of images of this galaxy. See how the galaxy looks "edge-on", and kind of like a disk? This is a "spiral galaxy" that is viewed edge-on. Be sure to grab a nice picture from this list for your final report.
Location Within the Virgo Cluster:
Looking at the Atlas of the Virgo Cluster listed above, you can see that the Virgo Cluster is centered near RA = 12h 30m and has two main groups, one centered near Dec = 12d 30m and a second (less populated) one near Dec = 8d 0m. From the NED listing of NGC4222 we see that its RA and Dec are 12h 16m 22.5s and +13d 18m 25s. That would put NGC4222 in the northern (higher Dec) group of the Virgo Cluster, on the western (to the right side in the Atlas picture of the Cluster) part of that northern group. It also has quite a few "neighbors" nearby.
Optical Appearance and Shape of HI Spectrum:
The optical picture of NGC4222 suggests that this spiral galaxy is viewed by us as nearly edge-on. This means that we are seeing its stars and gas along its plane of rotation. What that does to the HI line profile is that it makes it so that the parts of the galaxy that are rotating away from and toward us show up more strongly in HI. This happens because those receding and approaching parts of the galaxy look from our point of view to show us all of the gas in those parts of the galaxy. This makes the "horns" larger, since we are seeing more HI emitting gas than if we were just looking at the galaxy perpendicular to its plane (i.e. if the galaxy appeared to us to be "face-on").
Abbreviations and Acronyms
- RA = Right Ascension
- Dec = Declination
- s = seconds
- yr = years
- km/s = kilometers per second
- Mpc = mega-parsecs
Ideas, requests, problems regarding NRAO Public Wiki? Send feedback