|
|
You are here: NRAO Public Wiki>KPAF Web>DirectorsOffice>EngPlanning>SinglePixelTesting>KbandTests08Dec28 (2009-01-22, GlenLangston)
Edit wiki text
Edit
Attach
Print version
K-band FPGA Single Pixel Test Report for 2008 December 28
These single pixel tests compared the (K1) performance with the current GBT K-band receiver (K0). The observations were made under reasonable good weather conditions, but there was some humidity, which makes the direct comparison more difficult. We also searched IF spurs that might have been generated by the second type of down converter unit. The summary of our findings are:- The system temperature performance of the K0 and K1 systems are similar.
- No IF spurs were found in the K1 spectra obtained. Due to a lack of time, only part of the band was scanned for IF spurs.
K0 and K1 System Temperature comparisions
We observed source 3C123 with the K0 feed at 19, 23, 25 and 21 GHz (in that order), to get representative measures of the system temperature across the band. We also observed the same source at 25, 19, 21 and 23 GHz with the K1 feed. Below the system temperatures and source peak heights are listed in observing order The K1 Tcal temperatures were measured in the lab. Selected values are listed in the following table. These cal values are used to scale the K1 system temperatures.Freq. LCP RCP GHz K K 19 6.20 5.36 21 4.13 4.14 23 5.57 5.39 25 7.30 7.82The K1 cal values are used to convert the Tsys and Tsource values (measured with Astrid assuming Tcal = 1) to Kelvin Units. In the tables below, the Tsys values are measured from the noise-diode count (Countson, Countsoff) values. The source sntenna temperature values are deduced from measurements as follows:
Tsource = Tsys_off*(CountsOn-CountsOff)/CountsOff
Next the K0 system and source antenna temperatures are logged:
Scans Type  Feed  Center     LCP            RCP
                  Freq   Tsys   Peak    Tsys   Peak
                   GHz     K     K        K     K
 8-11 Peak   K0   25     52.2   2.55    53.1   3.35
12    Focus  K0   25     52.1   2.44    53.1   3.17
13-16 Peak   K0   23     60.3   3.36    61.5   3.48
17    Focus  K0   23     60.3   3.29    61.4   3.46
18-21 Peak   K0   19     37.8   4.78    39.0   5.16
22    Focus  K0   19     37.8   4.72    39.0   5.10
After the observations with the K0 feed were recorded, we switched to the single pixel and made peak and focus observations on the same source, at the same frequencies.
                             LCP            RCP           LCP           RCP
                         Tsys   Tpeak   TSys   Tpeak  Tsys   Tpeak  Tsys  Tpeak
                        counts counts  counts counts    K     K       K     K
31    Focus  k1   25      7.30  0.458    8.53  0.436  53.3   3.34   66.7   3.41
32-35 Peak   K1   25      7.46  0.314    8.69  0.306  54.5   2.29   68.0   2.39
37-40 Peak   K1   19      7.72  0.903    8.26  0.860  47.9   5.60   44.3   4.61
41    Focus  K1   19      7.76  0.931    8.30  0.871  48.1   5.77   44.5   4.67
44-47 Peak   K1   21     13.5   0.950   13.63  0.858  55.7   3.92   56.4   3.55
48    Focus  K1   21     13.45  0.950   13.56  0.852  55.5   3.92   56.1   3.53
54-57 Peak   K1   23     12.18  0.596   12.17  0.542  67.8   3.32   65.6   2.92
58    Focus  K1   23     12.22  0.560   12.20  0.510  68.1   3.11   65.8   2.75
We needed observations at 23 GHz with K0, in order to compare the observations and see how much the sky temperature had changed during the tests. We switched back to K0 for a short period. The final test was a repeat of the K1 observation at 25 GHz.
59-62 Peak   K0   23     69.5   3.47    70.9   3.62
63    Focus  K0   23     70.0   3.52    71.4   3.69
69-72 Peak   K0   21     59.5   3.85    66.8   4.53
73    Focus  K0   21     60.2   3.72    67.7   4.40
                            LCP            RCP           LCP           RCP
                         Tsys   Tpeak   TSys   Tpeak  Tsys   Tpeak  Tsys  Tpeak
                        counts counts  counts counts    K     K       K     K
74-77 Peak   K1   25      8.42  0.275    9.60  0.262  61.5   2.01   75.1   2.05
78    Focus  K1   25      8.51  0.316    9.69  0.277  62.1   2.31   75.8   2.17
These observations show a number of important points:
- The system temperature values for K0 and K1 are similar.
- The pair of 23 GHz observations with K0 suggests the sky brightness temperature increased by 10 K during the observations.
- The pair of 25 GHz observations with K1 suggests the sky brightness temperature increased by 9 K during the observations.
Scan for IF spurs: 3C123 Spectra
The second part of our test was a search for IF spurs that could have been generated by the down conversion units. The check was made by stepping across the spectral band from 18 to 22.4 GHz, performing 2 minute On-source, Off source observations. The results of these observations are shown in the figures below. There data are calibrated using the laboratory measurements of the noise source values. The Left Circular polarization is to the left and Right Circular Polarization is to the right.| K1 L-polarization Tsys_off (On-Off)/Off on 3C123: | K1 R-polarization Tsys_off(On-Off)/Off on 3C123: |
 |
 |
 |
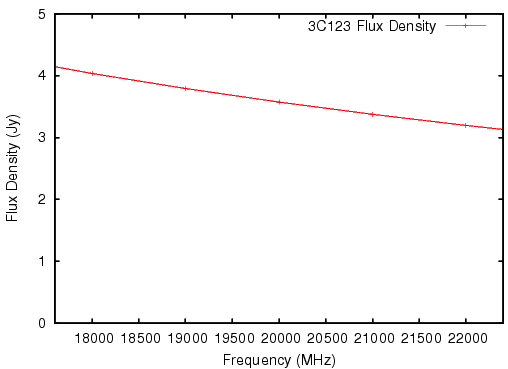
| Plot of 3C123 Flux density vs frequency |
Observing log
Start Stop   Source  Procedure  # RA-2000 Dec-2000    #  Sky Freq
Scan  can    Name                   (hms)   (d'")   Data (MHz)
 ====== /home/gbtdata/T_KFPA_08DEC28 ==== T_KFPA_08DEC28 ==== Glen Langston
   1    4     3c123       Peak  4  4h37m04 29d40'15  576 24999 DCR 2008_12_28_05:09:10
   5    5 3c123 FocusSubreflec  1  4h37m04 29d40'15  294 24999 DCR 2008_12_28_05:11:38
   6    6     3c123        Tip  1  3h41m43 10d02'02 1494 24999 DCR 2008_12_28_05:17:20
   7    7     3c123        Tip  1  3h48m03 10d00'07 1494 24999 DCR 2008_12_28_05:23:48
   8   11     3c123       Peak  4  4h37m04 29d40'15  576 24999 DCR 2008_12_28_05:31:16
  12   12 3c123 FocusSubreflec  1  4h37m04 29d40'15  294 24999 DCR 2008_12_28_05:33:41
  13   16     3c123       Peak  4  4h37m04 29d40'15  576 23000 DCR 2008_12_28_05:35:58
  17   17 3c123 FocusSubreflec  1  4h37m04 29d40'15  294 23000 DCR 2008_12_28_05:38:24
  18   21     3c123       Peak  4  4h37m04 29d40'15  576 19000 DCR 2008_12_28_05:40:47
  22   22 3c123 FocusSubreflec  1  4h37m04 29d40'15  294 19000 DCR 2008_12_28_05:43:12
  23   26     3c123       Peak  4  4h37m04 29d40'15  576 25000 DCR 2008_12_28_05:57:20
  27   30     3c123       Peak  4  4h37m04 29d40'15  576 25000 DCR 2008_12_28_06:03:58
  31   31 3c123 FocusSubreflec  1  4h37m04 29d40'15  294 25000 DCR 2008_12_28_06:08:43
  32   35     3c123       Peak  4  4h37m04 29d40'15  576 25000 DCR 2008_12_28_06:13:36
  36   36 3c123 FocusSubreflec  1  4h37m04 29d40'15  294 25000 DCR 2008_12_28_06:15:58
  37   40     3c123       Peak  4  4h37m04 29d40'15  576 19000 DCR 2008_12_28_06:20:36
  41   41 3c123 FocusSubreflec  1  4h37m04 29d40'15  294 19000 DCR 2008_12_28_06:23:00
  44   47     3c123       Peak  4  4h37m04 29d40'15  720 21000 DCR 2008_12_28_06:32:30
  48   48 3c123 FocusSubreflec  1  4h37m04 29d40'15  144 21000 DCR 2008_12_28_06:34:53
  49   52     3c123       Peak  4  4h37m04 29d40'15  576 21000 DCR 2008_12_28_06:39:57
  53   53 3c123 FocusSubreflec  1  4h37m04 29d40'15  144 23000 DCR 2008_12_28_06:42:20
  54   57     3c123       Peak  4  4h37m04 29d40'15  576 23000 DCR 2008_12_28_06:45:00
  58   58 3c123 FocusSubreflec  1  4h37m04 29d40'15  144 23000 DCR 2008_12_28_06:47:23
  59   62     3c123       Peak  4  4h37m04 29d40'15  576 23000 DCR 2008_12_28_06:57:47
  63   63 3c123 FocusSubreflec  1  4h37m04 29d40'15  144 23000 DCR 2008_12_28_07:00:09
  64   67     3c123       Peak  4  4h37m04 29d40'15  576 20999 DCR 2008_12_28_07:02:00
  68   68 3c123 FocusSubreflec  1  4h37m04 29d40'15  144 20999 DCR 2008_12_28_07:04:24
  69   72     3c123       Peak  4  4h37m04 29d40'15  576 20999 DCR 2008_12_28_07:10:07
  73   73 3c123 FocusSubreflec  1  4h37m04 29d40'15  294 20999 DCR 2008_12_28_07:12:30
  74   77     3c123       Peak  4  4h37m04 29d40'15  576 25000 DCR 2008_12_28_07:30:12
  78   78 3c123 FocusSubreflec  1  4h37m04 29d40'15  294 25000 DCR 2008_12_28_07:32:33
  79   82     3c123       Peak  4  4h37m04 29d40'15  576 25000 DCR 2008_12_28_07:35:33
  83   83 3c123 FocusSubreflec  1  4h37m04 29d40'15  144 25000 DCR 2008_12_28_07:37:56
  84   85     3c123      OnOff  2  4h41m41 29d40'15   12 18000 ACS 2008_12_28_07:50:42
  86   87     3c123      OnOff  2  4h41m41 29d40'15   12 18400 ACS 2008_12_28_07:53:47
  88   89     3c123      OnOff  2  4h41m41 29d40'15   12 18800 ACS 2008_12_28_07:56:52
  90   91     3c123      OnOff  2  4h41m41 29d40'15   12 19200 ACS 2008_12_28_07:59:57
  92   93     3c123      OnOff  2  4h41m41 29d40'15   12 19600 ACS 2008_12_28_08:03:00
  94   95     3c123      OnOff  2  4h41m41 29d40'15   12 20000 ACS 2008_12_28_08:06:03
  96   97     3c123      OnOff  2  4h41m41 29d40'15   12 20400 ACS 2008_12_28_08:09:06
  98   99     3c123      OnOff  2  4h41m41 29d40'15   12 20800 ACS 2008_12_28_08:12:11
 100  101     3c123      OnOff  2  4h41m41 29d40'15   12 21200 ACS 2008_12_28_08:15:14
 102  103     3c123      OnOff  2  4h41m41 29d40'15   12 21600 ACS 2008_12_28_08:18:17
 104  105     3c123      OnOff  2  4h41m41 29d40'14   12 22000 ACS 2008_12_28_08:21:21
 106  107     3c123      OnOff  2  4h41m41 29d40'15   12 22400 ACS 2008_12_28_08:24:26
-- GlenLangston - 2009-01-16


| I | Attachment | Action | Size | Date | Who |
Comment |
|---|---|---|---|---|---|---|
| |
3c123-k1-l.gif | manage | 22 K | 2009-01-20 - 11:37 | GlenLangston | K1 L-polarization (On-Off)/Off on 3C123 |
| |
3c123-k1-r.gif | manage | 19 K | 2009-01-20 - 11:38 | GlenLangston | K1 R-polarization (On-Off)/Off on 3C123 |
| |
3c123.ott | manage | 162 bytes | 2009-01-21 - 11:57 | GlenLangston | data table of 3C123 flux density vs frequency |
| |
3c123ott.gif | manage | 5 K | 2009-01-21 - 11:56 | GlenLangston | Plot of 3C123 Flux density vs frequency |
Edit | Attach | Print version | History: r6 < r5 < r4 < r3 | Backlinks | View wiki text | Edit wiki text | More topic actions
Topic revision: r5 - 2009-01-22, GlenLangston


- Webs
-
 ALMA
ALMA
- NAASC
- SCIIPT
- CDL
- CICADA
- Ccs
- Littlethings
- Cville
- DSAA
- EVLA
- FASR
- GB
- Computing
- Data
- Dynamic
- Electronics
- Gbtpipeline
- Knowledge
- Mechanical
- Observing
- WbandVLBACal
- Obsreports
- Operate
- PTCS
- OOF
- ServoImprovementsHome
- ServoSiteAcceptTestProcs
- Pennarray
- Projects
- Recreation
- Scicenter
- Skynet
- Software
- CLEO
- StaffEvents
- TACTool
- HPC
- JVLA
- KPAF
- Library
- Main
- Metrics
- NGVLA
- NM
- Computing
- Electronics
- OSAA
- OSX
- SRDP
- Software
- Algorithms
- CASA
- Splat
- System
- VLBA
Ideas, requests, problems regarding NRAO Public Wiki? Send feedback