|
|
You are here: NRAO Public Wiki>ALMA Web>NAASC>PipelineTestingMar2013>PipelineFlaggingMar2013 (2013-05-09, JaredCrossley)
Edit wiki text
Edit
Attach
Print version
Differences between Pipeline and Manual Flagging
This page describes the flagging differences between the pipeline and manual reductions of the data sets in rows 1 - 18 of PipelineTestingMar2013. These results only include the flagging visible in the analyzemscal (AMC) HTML output. Pipeline calibration table flagging (for failed solutions) was recently added to AMC's output; these flags have not yet been included in the lists below. ASDM headings below are linked from the "Flagging" column of PipelineTestingMar2013. ACTION| |
Note that all data flagged by cal table solution failures should be flagged earlier; otherwise, these data corrupt data that is not flagged. |
| |
Create rogues gallery of weird or unusual problems so we can confirm these problems have been resolved. |
| |
Look for online flags that may match bad data that should have been flagged at the beginning or end of scan. In some cases, these online flags had incorrect time stamps (start and end time inverted, start time too early). |
Summary
Similarities
- The pipeline always flags (I do not include these in the Detailssection below):
- shadow data
- intents *POINTING*, *ATMOSPHERE*, *SIDEBAND_RATIO*
- autocorrelations
- Manual reduction script always flags (I do not include this in the Details section below):
- shadow data
- intents *POINTING*, *SIDEBAND_RATIO*, *ATMOSPHERE*
- autocorrelations
- All Tsys ploblems flagged by manual reducers were also flagged by pipeline.
Differences
- It appears that pipeline only flags edge channels for TDM mode.
- The pipeline did not flag the beginning or end of scans. Manual reducers have done this for some data sets. Plots
- The pipeline did not flag atmospheric lines.
- The pipeline does not flag bad pointing. Plots
Cycle 0 Details
This list describes for each cycle 0 ASDM in PipelineTestingMar2013 all flagging that is included in the analyzemscal HTML. Flagging done in the manual reduction is written in normal text. Flagging done in pipeline reduction is written in bold text. Each bullet describes a separate flagging issue. When the pipeline and manual reduction flag the same (or mostly the same) data, I have included both in a single bullet. At the time of writing it was unclear from the analyzemscal output whether the pipeline flagged some or all described data; in these cases I have written "some (or all)" in the list below.uid___A002_X383b50_Xc45
- Reducer flagged atmospheric lines.
- Pipeline flags DV15 with hif_wvrgcalflag (not warranted).
- Pipeline flags PM01, PM02 (failed calibration)
uid___A002_X4320bd_X77f
- Manual reducer flags 8 edge channels. Pipeline flags 9 or 10 edge channels; .
- Manual reducer flags PM02 because "it doesn't lock in B6". Pipeline flags PM02 for bad Tsys.
- Manual reducer flags DV19 because bandpass has issues. Pipeline flags most of DV19 for bad Tsys.
- Pipeline flags 19 antennas, bandpass scan (failed calibration).
uid___A002_X54d35d_X761
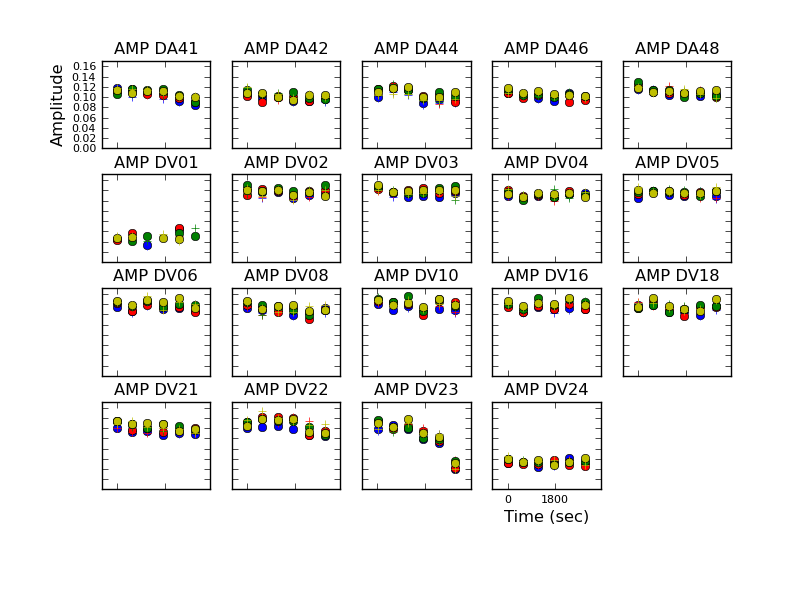
- Reducer flagged DV13, 8s at beginning of scan.
 Manual |
 Pipeline |
plotms( vis = 'uid___A002_X54d35d_X761.manual.ms.split', xaxis = 'time', yaxis= 'amp', ydatacolumn = 'corrected', spw = '0,1,2,3', # science spws scan = '4', avgchannel = '1e6', coloraxis = 'corr' ) plotms( vis = 'uid___A002_X54d35d_X761.pipeline.ms', xaxis = 'time', yaxis ='amp', ydatacolumn = 'corrected', spw = '17,19,21,23', # science spws scan = '4', avgchannel = '1e6', coloraxis = 'corr' ) |
- Reducer flagged DV22 SPWs 0, 1 for bad Tsys (in SPW 13).
- Reducer flagged DV22 SPW 2 for bad Tsys (in SPW 13). Pipeline flagged DV22 SPW 13. (bad Tsys, failed gain cal.)
- Reducer flagged DV22, SPW 3, 13s at beginning of scan .
- Reducer flagged DA44, 2s at end of scan.
- Reducer flagged DV07&PM02, SPW 3.
- Reducer flagged PM02, SPW 2, YY for low amplitude.
- Reducer flagged DV07 for low amplitude after applycal.
 Pipeline |
Pipeline DV07 gain solutions have low amplitude. |
uid___A002_X3fdb4f_X5e4
- Reducer flagged atmospheric lines.
- Reducer flagged DV15.
uid___A002_X4320bd_Xc78
- Reducer flagged DV08 for bad Tsys. Pipeline flagged some (or all) of DV08.
uid___A002_X57b9e2_X22a
- Reducer flagged 46 and 41 edge channels on all SPWs (FDM mode).
- Reducer flagged DV01, DV23, DV24 for bad pointing and low gain.
- Reducer flagged DV16, 1 integration, beginning of 1 scan.
 Pipeline |
 Manual |
Pre-bandpass phase vs. time on bandpass calibrator. The first integration was flagged by the manual reducer but not by the pipeline. |
- Reducer flagged atmospheric line.
uid___A002_X5784d5_X32d
- Reducer flagged 46 and 41 edge channels on all SPWs (FDM mode).
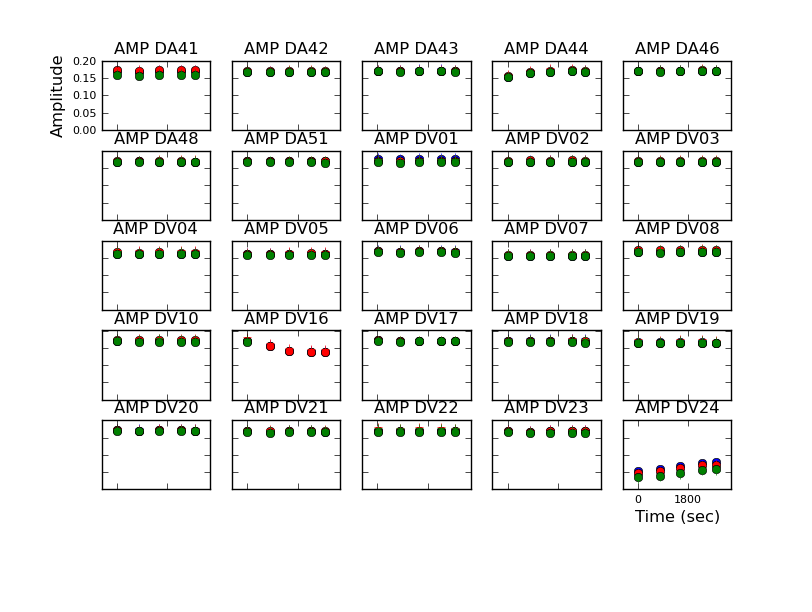
- Reducer flagged DV24 for bad pointing. (AMC identified DV24 and DV23 has having suspect pointing.)
 Pointing |
 Gain cal amp |
Pipeline gain calibration amplitude on phase calibrator is low for DV24. |
- Reducer flagged bad channels, spw = ' 0:960~1920 , 3:0~3839 '.
 pipeline |
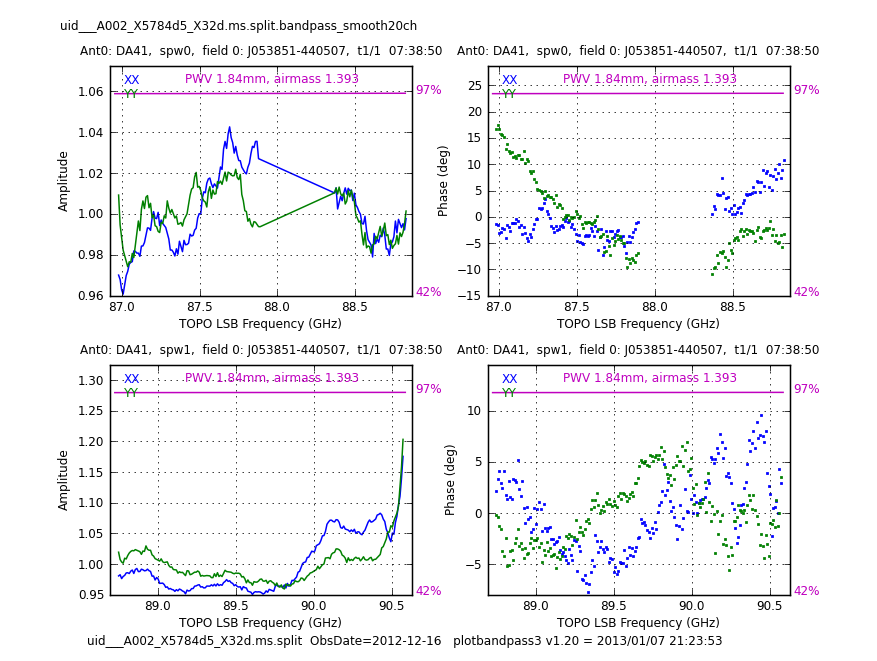 manual |
Category: correlator problem The SPW 0 problem is visible in the bandpass calibration solutions. It is also visible in the gain calibration solutions contained in the AMC output. The SPW 3 problem has been reported on line 2.18 of . |
- Pipeline flagged some (or all) of SPW 15.
uid___A002_X3f8662_Xa8
- Reducer flagged 46 and 41 edge channels on all SPWs (FDM mode).
- Reducer flagged PM02. Pipeline flagged some (or all) of PM02.
- Reducer flagged DV15, 1 integration, bandpass calibrator.
- Reducer flagged atmospheric line.
- Pipeline flagged some (or all) of DV05, SPW 9, pol 0.
- Pipeline flagged DV05, SPW 11, pol 0, channels 0~3.
uid___A002_X4b6a0b_X12f
- Reducer flagged 8 edge channels. Pipeline flagged 9 edge channels.
- Reducer flagged DA49, SPW 1 (no reason given). Pipeline flagged DA49, SPW11 for bad Tsys.
- Reducer flagged DV16, SPW 1. Pipeline flagged DV16, SPW 11, channels 0~3, pol YY for bad Tsys.
- Reducer flagged DA41. Pipeline flagged DA41 (failed bandpass calibration).
- Pipeline flagged DV04, SPW 15, pol XX, field 0, field 1. for bad Tsys
- Pipeline flagged PM03, SPW 11, channels 0~3, pol XX, field 0, field 1 for bad Tsys.
- Pipeline flagged DA42 (failed bandpass calibration).
uid___A002_X3fdb4f_X78c
- Reducer flagged 8 edge channels. Pipeline flagged 9 edge channels.
- Reducer flagged DV08 for bad Tsys on SPW 0. Pipeline flagged DV08, all SPWs, for bad Tsys.
uid___A002_X47aefc_X109
- Reducer flagged DV08 for amplitude scatter.
- Reducer flagged DV20, pol YY, scan 29 for amplitude scatter.
- Reducer flagged 140 and 200 edge channels for noise.
- Reducer flagged SPW 2, channels 140~180 for atmospheric line in BP cal (already flagged as edge channels).
- Reducer flagged SPW 3, channels 2680~2730 for atmospheric line in BP cal (partially flagged as edge channels).
- Pipeline flagged some (or all) of DV02.
- Pipeline flagged DV09, SPW 9, pol YY, some scans.
uid___A002_X5784d5_X7ae
- Reducer flagged atmospheric lines.
- Reducer flagged bad edge channels.
- Reducer flagged DV01 and DV24 for large pointing offsets. (Note: analyzemscal also identified DV23 as having large pointing offsets.
 AMC pointing solutions |
 Pipeline gain cal. solutions |
The 3 antennas that have large pointing solution offsets also have low gain calibration solution amplitudes. DVO1 is flagged in the pipeline gain cal. table. However, DV23 and DV24 are not flagged. |
uid___A002_X45c06b_Xabf
- Reducer flagged 8 edge channels. Pipeline flagged 9 edge channels.
- Pipeline flagged DV16, SPW 11, pol XX, channels 0~3, fields 0 2 3.
- Pipeline wvrgcal flags DV16, but not warranted.
uid___A002_X3fdb4f_X463
- Reducer flagged 8 edge channels. Pipeline flagged 9 edge channels.
- Pipeline flagged some (or all) of DV05, SPW 11, pol XX.
uid___A002_X4b58a4_X31
- Reducer flagged less than 8 edge channels; the number of channels on each SPW were chose so that all SPWs combined to create one continuous spectrum. Pipeline flagged 9 edge channels.
- Reducer flagged DV03 for noisy phases (high Tsys). Pipeline flagged DV03 with wvrflag.
- Reducer flagged PM02 and DA48 for bad bandpass (consistent with bad pointing noted by shiftlog tool). analysmscal did not identify either antenna as having bad pointing. Pipeline flagged PM02 and DV48 with wvrflag.
- Reducer flagged DA49 for large phase offsets.
- Reducer flagged scan 32 for low amplitudes.
- Reducer flagged DA41 for a large phase difference between SPWs 1, 2, 3 and SPW 0 (flagged after applycal).
uid___A002_X49a70a_X4d8
- Reducer flagged 8 edge channels. Pipeline flagged 9 edge channels.
- Reducer flagged atmospheric lines.
- Reducer flagged DV15, one integration at beginning of scan. (no similar entries in online flags file)
 Pipeline w/ DV15 |
 Pipeline w/o DV15 |
First integration amplitudes are lower when DV15 is included. Without DV15, the outliers for all integrationsdisappear. plotms(vis=vis, xaxis='time', yaxis='amp', ydatacolumn='corrected', spw='9,11,13,15', scan='28', avgchannel='1e6', avgantenna=True, avgspw=True, coloraxis='antenna1', plotrange=[0,0,.38,.52], plotfile='uid___A002_X49a70a_X4d8_wDV15.png') plotms(vis=vis, xaxis='time', yaxis='amp', ydatacolumn='corrected', spw='9,11,13,15', antenna='!DV15', scan='28', avgchannel='1e6', avgantenna=True, avgspw=True, coloraxis='antenna1', plotrange=[0,0,.38,.52], plotfile='uid___A002_X49a70a_X4d8_woDV15.png') |
- Reducer flagged PM01, one integration at beginning of scan. (no similar entries in online flags file)
- Reducer flagged DV17, one integration at beginning of scan. (no similar entries in online flags file)
- Reducer flagged DV17, one integration at beginning of scan. (no similar entries in online flags file)
uid___A002_X40e374_X366
- Pipeline flagged DV15 with wvrgcalflag.
- Reducer flagged atmospheric lines.
- Reducer flagged SPW 0:2800~3200 for bandpass calibrator absorption.
uid___A002_X5552a3_X9ef
- Pipeline flagged DV05, DV16 with wvrgcalflag.
- Reducer flagged SPW 0:2800~3200 for CO absorption in bandpass calibrator.
Cycle 1 Details
Manual reduction is not available for cycle 1 data.uid___A002_X609bf6_Xafe
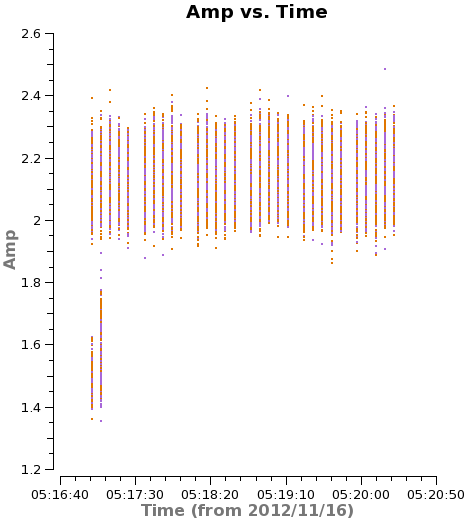
The pipeline output for this ASDM shows many antennas that have low amplitudes at the beginning of scans. A sampling of this bad data is below.  Amp. vs. Time on SPW15, zoomed in |
4 integrations here have low amplitudes. All low amplitudes come from DA42. None of these integrations show up in the online flags. |
 SPW 19, scan 22, field 3 |
The low amplitude points here come from many antennas. This integration is not flagged in the online flags file. plotms( vis='uid___A002_X609bf6_Xafe.ms', xaxis = 'time', yaxis = 'amp', ydatacolumn = 'corrected', field = '3', spw = '19', antenna = '!DA52', scan = '22', avgchannel = '1e6', plotrange = [0,0,2.3,3], coloraxis = 'antenna1' ) |


| I | Attachment | Action | Size | Date | Who | Comment |
|---|---|---|---|---|---|---|
| |
c1ant_amp_temporal.png | manage | 59 K | 2013-04-22 - 15:14 | JaredCrossley | Pipeline gain cal solutions for uid___A002_X54d35d_X761 |
| |
uid___A002_X49a70a_X4d8_wDV15.png | manage | 14 K | 2013-05-03 - 11:11 | JaredCrossley | uid___A002_X49a70a_X4d8 Amp vs. Time for scan 28, w/ DV15 |
| |
uid___A002_X49a70a_X4d8_woDV15.png | manage | 14 K | 2013-05-03 - 11:12 | JaredCrossley | uid___A002_X49a70a_X4d8 Amp vs. Time for scan 28, w/o DV15 |
| |
uid___A002_X54d35d_X761.manual.ms.split_AmpVsTime_Scan4.png | manage | 15 K | 2013-04-16 - 10:03 | JaredCrossley | uid___A002_X54d35d_X761.manual.ms.split_AmpVsTime_Scan4.png |
| |
uid___A002_X54d35d_X761.pipeline.ms_AmpVsTime_Scan4.png | manage | 14 K | 2013-04-16 - 10:18 | JaredCrossley | uid___A002_X54d35d_X761.pipeline.ms_AmpVsTime_Scan4.png |
| |
uid___A002_X54d35d_X761_c1ant_amp_temporal.png | manage | 49 K | 2013-04-24 - 09:35 | JaredCrossley | uid___A002_X54d35d_X761 gain table amplitudes |
| |
uid___A002_X5784d5_X32d.pointing.scan08.png | manage | 63 K | 2013-04-26 - 15:38 | JaredCrossley | uid___A002_X5784d5_X32d pointing plot |
| |
uid___A002_X5784d5_X32d_c1ant_amp_temporal.png | manage | 41 K | 2013-04-26 - 15:38 | JaredCrossley | uid___A002_X5784d5_X32d gain cal amplitude plot |
| |
uid___A002_X5784d5_X32d_manual_bandpass.png | manage | 105 K | 2013-04-25 - 16:40 | JaredCrossley | uid___A002_X5784d5_X32d manual reduction bandpass solutions |
| |
uid___A002_X5784d5_X32d_pipeline_bandpass.png | manage | 106 K | 2013-04-25 - 16:40 | JaredCrossley | uid___A002_X5784d5_X32d pipeline bandpass solutions |
| |
uid___A002_X5784d5_X7ae.pointing.scan05.png | manage | 56 K | 2013-04-17 - 12:06 | JaredCrossley | Pointing solution plot |
| |
uid___A002_X57b9e2_X22a_prebandpassCal_DV16_pipeline.png | manage | 285 K | 2013-04-26 - 16:47 | JaredCrossley | uid___A002_X57b9e2_X22a_prebandpassCal_DV16_pipeline.png |
| |
uid___A002_X609bf6_Xafe_ampVsTime_SPW15_zoom.png | manage | 14 K | 2013-05-09 - 13:29 | JaredCrossley | uid___A002_X609bf6_Xafe_ampVsTime_SPW15_zoom.png |
| |
uid___A002_X609bf6_Xafe_ampVsTime_SPW19.png | manage | 16 K | 2013-05-09 - 13:51 | JaredCrossley | |
| |
uid___A003_X57b9e2_X22a_prebandpassCal_DV16_manual.png | manage | 267 K | 2013-04-26 - 16:48 | JaredCrossley | uid___A003_X57b9e2_X22a_prebandpassCal_DV16_manual.png |
Edit | Attach | Print version | History: r30 < r29 < r28 < r27 | Backlinks | View wiki text | Edit wiki text | More topic actions
Topic revision: r30 - 2013-05-09, JaredCrossley


- Webs
-
 ALMA
ALMA
- NAASC
- SCIIPT
- CDL
- CICADA
- Ccs
- Littlethings
- Cville
- DSAA
- EVLA
- FASR
- GB
- Computing
- Data
- Dynamic
- Electronics
- Gbtpipeline
- Knowledge
- Mechanical
- Observing
- WbandVLBACal
- Obsreports
- Operate
- PTCS
- OOF
- ServoImprovementsHome
- ServoSiteAcceptTestProcs
- Pennarray
- Projects
- Recreation
- Scicenter
- Skynet
- Software
- CLEO
- StaffEvents
- TACTool
- HPC
- JVLA
- KPAF
- Library
- Main
- Metrics
- NGVLA
- NM
- Computing
- Electronics
- OSAA
- OSX
- SRDP
- Software
- Algorithms
- CASA
- Splat
- System
- VLBA
Ideas, requests, problems regarding NRAO Public Wiki? Send feedback