|
|
You are here: NRAO Public Wiki>ALMA/NAASC Web>Memo114Appendices (2016-12-15, ToddHunter)
Edit wiki text
Edit
Attach
Print version
Ancillary material for Single Dish Imaging Memo
Output from grid_tests.py (described in section 5.2 of the memo)
- The table below contains the output from the script grid_tests.py, which shows how the beamsize, peak intensity and flux densities vary with the number of pixels per beam for four different choices of support width for the gridding function.
- Clicking on the thumbnail image for a Band/Antenna combination will take you to a separate page where all the images for that combination are displayed. Alternatively, you can view all plots collected in a 43-page PDF.
| Mars Band 3 | 3c279 Band 3 | Mars Band 6 | Uranus Band 7 | |
| SF | 
| 
| 
| 
|
| GJINC | 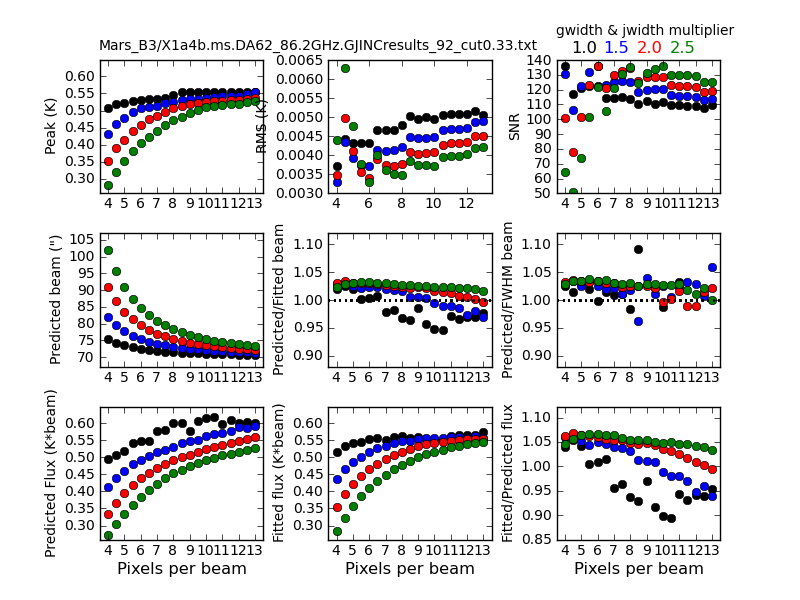
| 
| 
| 
|
Comparison of TICRA models with astroholography images (described in section 3.3 of the memo)
- The table below contains the XX polarization images from the 2013 astroholography campaign compared to the TICRA H-polarization model. The images were taken from the scops cluster in the directory: /mnt/scops/data/data/dgunawan/PrimaryBeams.
- Clicking on the thumbnail image for a Band/Antenna combination will take you to a separate page where all the images for that combination are displayed.
| DA | DV | PM | |
| Band | TICRA image holography image
| TICRA image holography image
| TICRA image holography image
|
| 3 | 
| 
| 
|
| 6 | 
| 
| 
|
| 7 | 
| 
| 
|
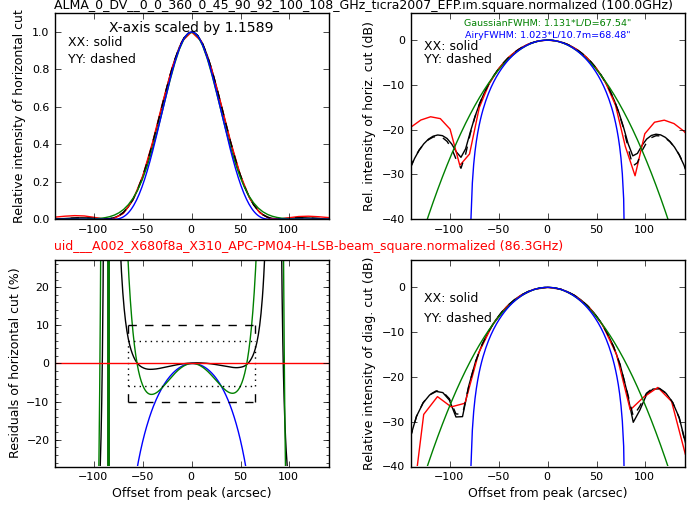
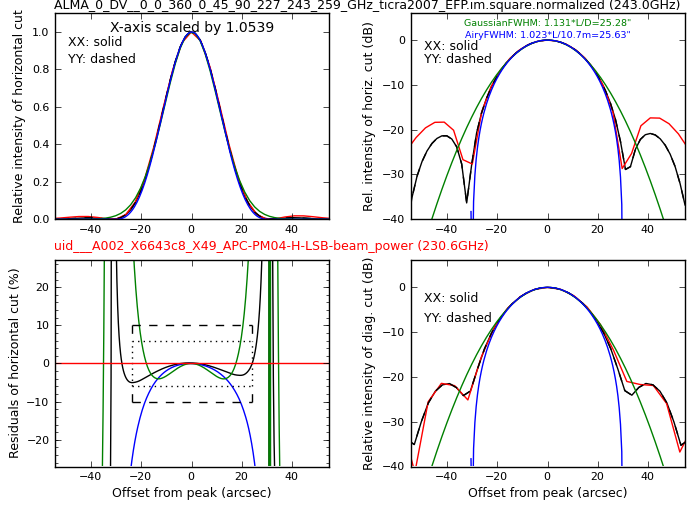
Comparison of profiles from TICRA models and astroholography images (as described in section 3.3 of the memo)
- Clicking on the thumbnail image for a Band/Antenna combination will take you to a separate page where all the images for that combination are displayed.
| Band | DA | DV | PM |
| 3 | 
| 
| 
|
| 6 | 
| 
| 
|
| 7 | 
| 
| 
|


Edit | Attach | Print version | History: r7 < r6 < r5 < r4 | Backlinks | View wiki text | Edit wiki text | More topic actions
Topic revision: r7 - 2016-12-15, ToddHunter


Ideas, requests, problems regarding NRAO Public Wiki? Send feedback